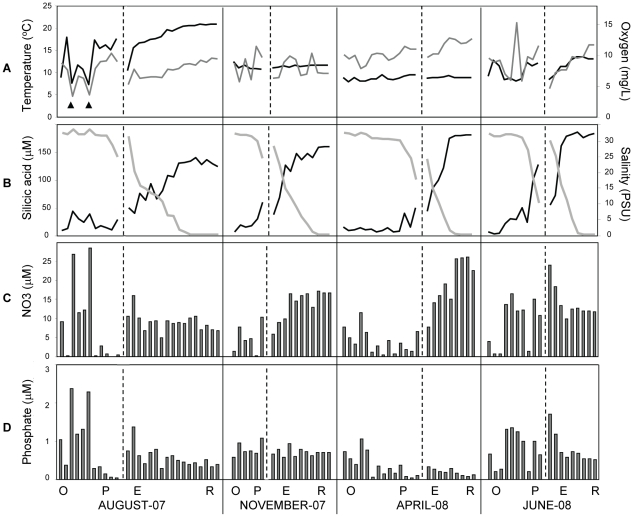
Figure 2. Selected physical and chemical characteristics corresponding to the seasonal sample sets collected for microarray analysis.
In all graphs, the X-axis indicates samples sorted first from left to right, according to year and month starting from August and November, 2007, then April and June, 2008; second, within each month by location, starting with the coastal ocean through the plume and estuary to the river; and third, according to salinity within each location, from high (left) to low (right). (A) Temperature (black line) and oxygen concentration (gray line); (B) Silicic acid concentration (black line) and salinity (gray line); (C) and (D), nitrate and phosphate concentrations, respectively. Black vertical lines divide seasons, dashed vertical lines within each season divide the ocean (O) and plume (P) from estuary (E) and river (R) samples. The months in which sampling occurred are indicated below.

