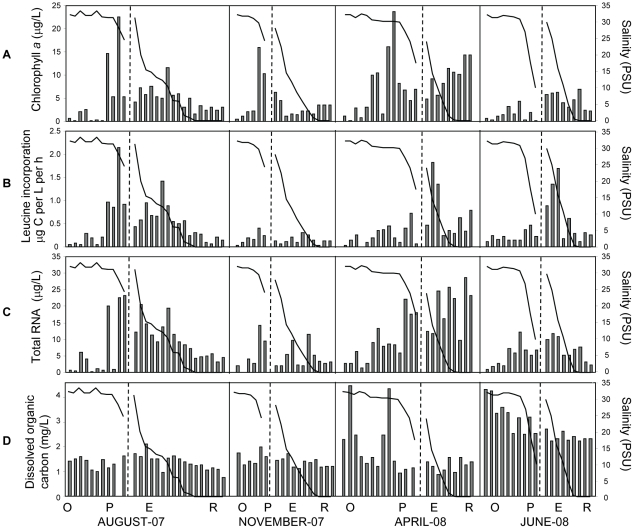
Figure 3. Biological characteristics of the seasonal sample sets collected for microarray analysis.
In all graphs, the X-axis shows samples sorted as described in Fig. 2. Salinity plots are superimposed with the bar graphs. (A), chlorophyll a content; (B) bacterial carbon production measured by leucine incorporation; (C) total RNA concentrations normalized per liter of sampled water; and (D), dissolved organic carbon content. Black vertical lines divide seasons, dashed vertical lines within each season divide the ocean (O) and plume (P) from estuary (E) and river (R) samples. Seasons are shown as months below the graphs.

