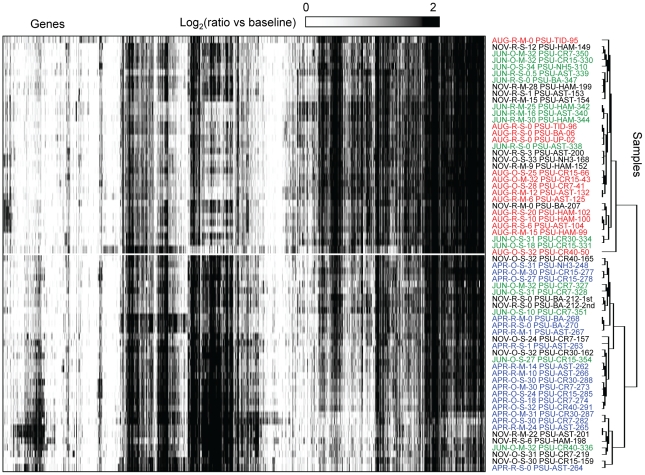
Figure 4. Expression profiles in the seasonal sample sets, displayed as fold changes over the background.
Two-dimensional clustering of 2076 probes corresponding to expressed genes (columns) and 56 samples (rows) was done using BRB ArrayTools software based on similarity matrix calculated with an agglomerative algorithm, and complete link correlation. Expression values are colored according to the ratio of signal to the background (displayed using a logarithmic scale). White to black scale indicates magnitude (from low to high). Sample names are composed of season (Apr, Jun, Aug, and Nov), habitat (R, river and estuary; O, plume and coastal ocean), depth (S, surface 1–3 m; M, mid-depth 4–50 m), location, and unique sample number. Location codes: number shows distance from the coast in km; CR, Columbia River transect in the plume and coastal ocean; NH, Newport Hydroline transect in the coastal ocean at Newport; AST and HAM, estuary locations near Astoria (river mile 7–9) and Hammond (river mile 5), respectively; TID, estuary locations in the tidal basin (river mile 22–23); BA, river location at Beaver Army Dock (river mile 53) near Quincy, Oregon; UP, river at mile 74.

