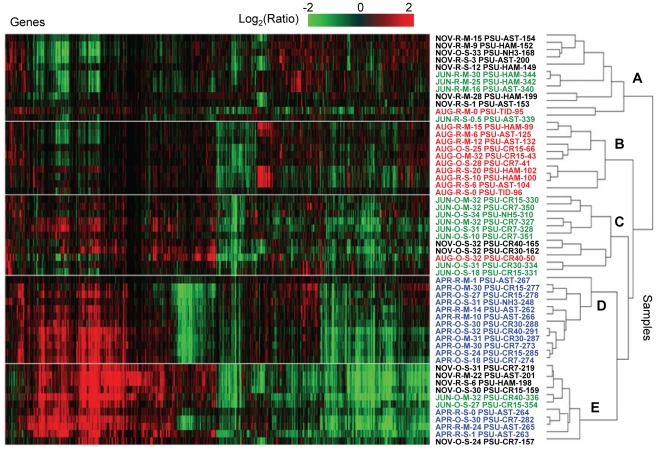
Figure 5. Differential expression across salinity gradients of the CRCM compared to seasonal tidal freshwater baselines.
Gene expression ratios were calculated for each probe in each sample as log (base 2) transformed ratios over the corresponding seasonal average freshwater values. Genes were selected as differentially expressed if they had ratios over 2-fold in at least two different samples. Two-dimensional clustering of 1496 differentially expressed genes (columns) and 56 samples (rows) was performed using BRB ArrayTools software based on similarity matrix calculated with an agglomerative algorithm, and complete link correlation. Expression data are colored according to fold changes in the mRNA levels (displayed using a logarithmic scale). Green and red colors indicate decreased and increased values, respectively, within a sample relative to the seasonal freshwater baseline. The color scale indicates the magnitude of change. Sample names are colored according to the season: blue, April 2008; green, June 2008; red, August 2007; and black, November 2007. Samples are designated as described in Fig. 4.

