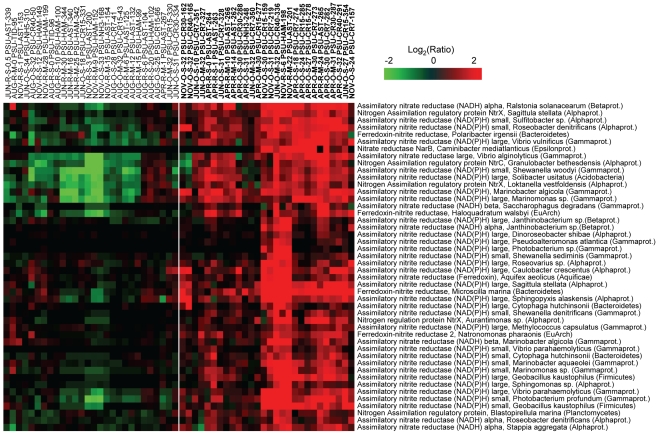
Figure 6. High relative expression of nitrate assimilation genes in comparison to the corresponding seasonal freshwater baseline.
Gene sets were selected from clusters C–E of Fig. 5. Expression ratio calculations, 2D clustering, and the heat map display were prepared as described in Fig. 5, except that samples are shown as columns, and genes as rows. Gene names include the corresponding organism and phylum information. The sample cluster that has the upregulation pattern is separated from the rest of heat map by the while line, and the corresponding sample names are shown in bold.

