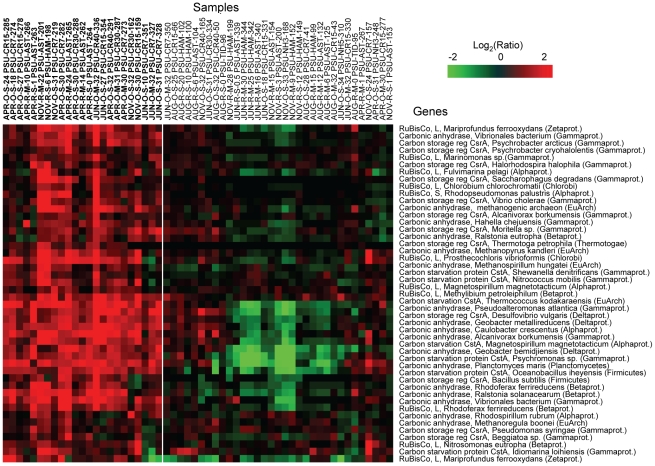
Figure 8. High relative expression of genes involved in carbon fixation, scavenging, and storage.
Gene sets were selected from clusters C–E of Fig. 5. Expression ratio calculations were performed relative to the corresponding seasonal freshwater baseline; 2D clustering, and heat map display were done as described in Fig. 5 and 6.

