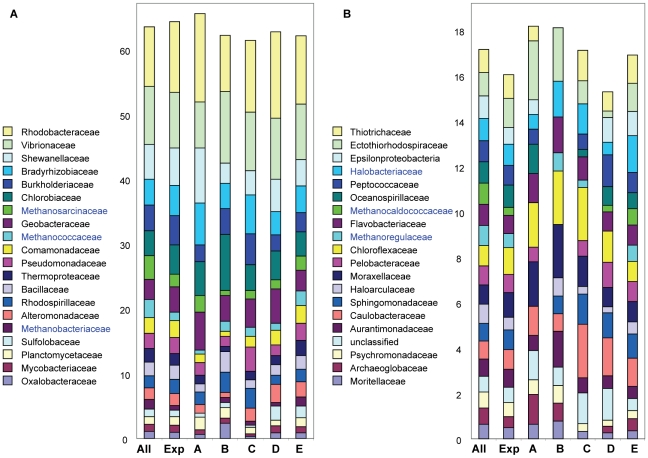
Figure 9. Phylogenetic analysis of differentially expressed microarray gene sets.
For each cluster (corresponding to clusters A–E in Fig. 5), all genes upregulated over 2-fold relative to the seasonal freshwater baseline in at least 2 samples were selected (for cluster A, 160; B, 135; C, 301; D, 372; and E, 575 genes). The percentages of different prokaryotic families within each gene set are shown by different colors within the bar graphs. To the left is shown family representation of the entire probe set and of the probe set corresponding to expressed genes. Only families represented by a minimum of 15 probes are shown, these comprise 40 of the 96 total families. (A) The top 20 microbial families represented by >61% of the 2226 probe set; and (B) the next 20 microbial families represented by >16% of all probes. Euryarchaeota families with relatively high differential gene expression in cluster E are indicated in blue.

