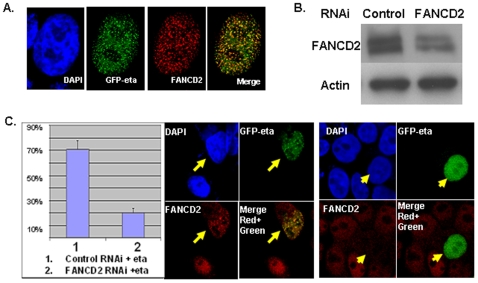
Figure 3. Polymerase Eta Focus Formation Depends on FANCD2.
A. FANCD2 foci colocalize with the foci of polymerase eta. U2OS cells were split at 30% confluence the day before transfection. At 24 hours after transfection, cells transfected with GFP-eta plasmid or empty vector control were treated with UV (25 J/m2), and were collected 8 hours after UV exposure. Subsequently, these cells were fixed for a standard immunofluorescent study by using antibodies against human FANCD2. FANCD2 foci can colocalize with the green foci, which result from the exogenous GFP-fused polymerase eta. (We did not observe any green foci or a clear green signal in the nuclei of the cells transfected with empty vector control - data not shown.) (The yellow dots show the colocalization.) (B, C) Knocking Down FANCD2 Proteins leads to a Decreased Percentage of Polymerase Eta Focus Formation, Cells were first transfected with control RNAi oligos or oligos specifically targeting FANCD2. These cells were then transfected with GFP-pol η at 24 hour point after RNAi oligo transfection. These doubly transfected cells were next treated with UV (20 J/m2) 24 hours after transfection and were collected 8 hours after UV treatment. Subsequently, a standard immunofluorescence assay was performed. Total levels of FANCD2 protein were detected in cells with control RNAi oligos and FANCD2 RNAi oligos (B). The ratio of green focus formation over total green cells was decreased in cells expressing FANCD2 at a lower level (C left). The typical image of two given cells expressing FANCD2 protein at a high or low level, showed focus formation or non-focus formation of pol η, respectively. (Standard deviation was generated from three separate experiments.) (The arrows mark the same individual cell for each panel, and the red stain represents FANCD2 protein; green for pol η; blue for nuclear staining; and yellow for the merge of red and green.).

