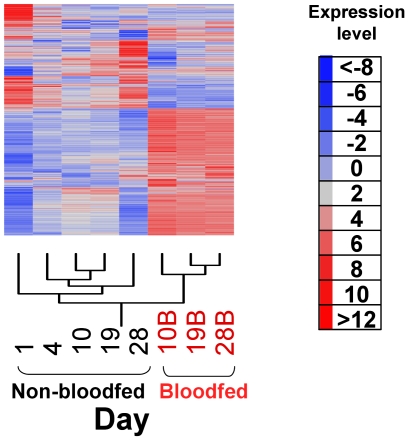
Figure 1. Hierarchical clustering analysis of gene expression in Anopheles gambiae adult female mosquitoes of different age groups maintained with access to plant sugar or sugar and rabbit blood.
Graphic heat maps represent transcripts expressed differentially among all the age groups (n = 276, p values <0.001). Each row represents data for one probe and each column corresponds to an age group, referred as chronological age (days post adult emergence, pupal-adult ecdysis).

