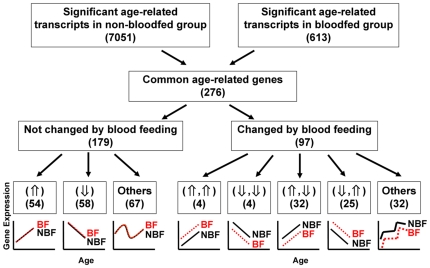
Figure 2. Flowchart of data analysis and identification of age-related transcript accumulation.
The numbers in parentheses represent the number of gene-specific transcripts in each category. The ‘⇑’ symbol indicates gene expression increasing with age; ‘⇓’ indicates expression decreasing with age; ‘⇑,⇑’ expression increasing with age and up-regulated by blood feeding; ‘⇓,⇓’ expression decreasing with age and down-regulated by blood feeding; ‘⇑,⇓’ expression increasing with age and down-regulated by blood feeding; and ‘⇓,⇑’ expression decreasing with age and up-regulated by blood feeding. Genes in the ‘⇑’ and ‘⇓’ categories are considered candidates for the development of a gene expression-based mosquito age-grading methodology.

