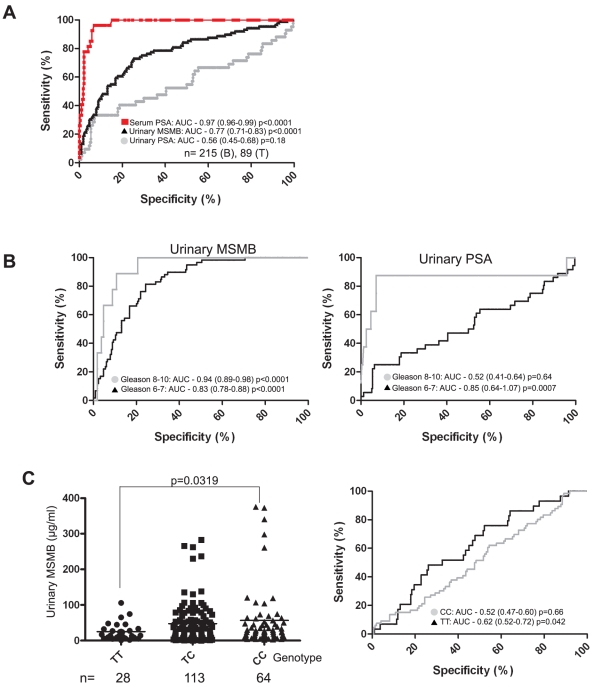
Figure 3. The rs10993994 SNP correlates with urinary MSMB protein expression.
Urinary MSMB and PSA concentrations were determined and normalised to creatinine. (A) Urinary MSMB was determined by ELISA for the normal/benign patient cohort and a smaller cohort with a prostate cancer diagnosis. The same cohort was also tested for urinary PSA and serum PSA values collated. ROC curves were generated; AUC = area under the curve, confidence intervals are given in brackets and p values are given at 95% confidence levels. The difference between urinary MSMB and PSA ROC curves p = 0.0021. The difference between the urinary MSMB and The tumour cohort was further stratified by Gleason sum score (B). Urinary MSMB and PSA from low Gleason samples (6 and 7) were compared to high Gleason (8 and 9) samples and ROC curves generated and displayed as before. Urinary MSMB was also stratified according to the rs10993994 risk allele (C). n = the number of individuals examined in each group.

