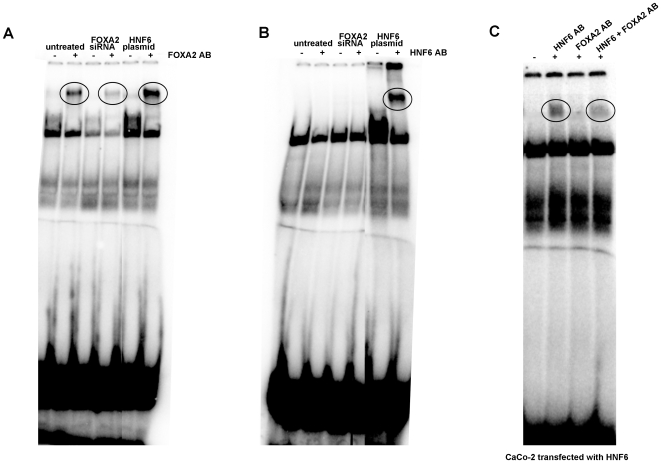
Figure 5. Electromobility band shift assay with nuclear extracts isolated from either untreated or FOXA2 siRNA or HNF6 plasmid expression cells.
Panel A: Depicted is the DNA binding activity of FOXA2 to an optimized probe. Specificity of the DNA binding is confirmed by adding a FOXA2 antibody which resulted in a shifted band. A circle marks the shifted band. Note, siRNA of FOXA2 resulted in a marked reduced DNA binding of the FOXA2 protein to its cognate recognition site. Importantly, FOXA2 DNA binding activity is strongly increased in HNF6 plasmid expressing cells. Panel B: Depicted is the DNA binding activity of HNF6 to an optimized probe. Specificity of the DNA binding is confirmed by adding a HNF6 antibody, which resulted in a shifted band which is marked by a circle. In untreated cells no HNF6 DNA binding is observed and for such cell cultures FOXA2 siRNA did not influence HNF6 DNA binding activity. In HNF6 plasmid expressing cells high HNF6 DNA binding activity is observed. Panel C: Depicted is the DNA binding activity of HNF6 transfected Caco-2 cell nuclear extracts to an optimized probe. A marked reduction in DNA binding activity of HNF6 is observed when an antibody recognizing FOXA2 is added concomitantly. Likewise, addition of antibodies specific for HNF6 and FOXA2 reduced HNF6 DNA binding activity to an HNF6 optimized oligonucleotide probe.

