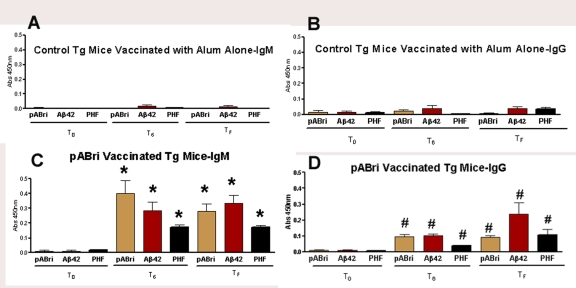
Figure 2. Antibody levels in control and pABri vaccinated mice.
Shown are bar graphs of the IgG and IgM antibody levels against polymerized ABri, Aβ42 and PHF at T0, T6 and TF. In A and B, titers of IgM and IgG in controls are shown, respectively. In C and D, titers of IgM and IgG in pABri vaccinated mice are shown, respectively (*p<0.0001, #p<0.01).

