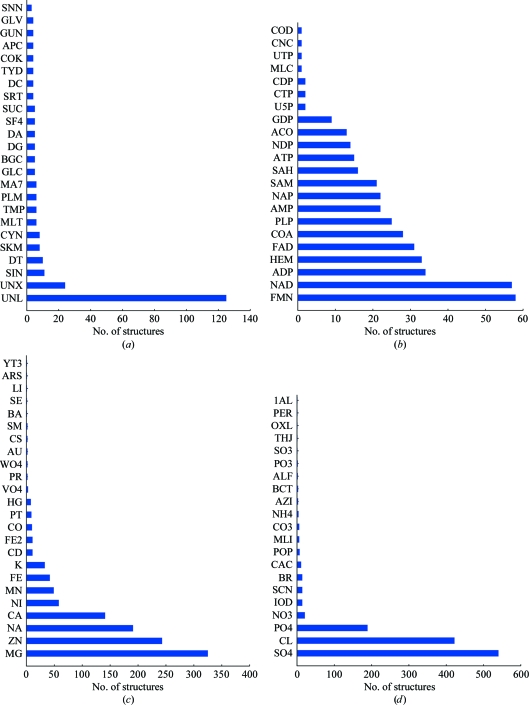
Figure 3.
Distribution of various ligands by category and relative frequency. Only the most common of these small molecules are shown. The names of the ligands follow the IDs used in the PDB and their full names can be obtained from the Ligand Expo Server (http://ligand-depot.rcsb.org/ld-search.html). (a) The ‘Ligands’ category includes biological ligands, such as substrates/products or their analogs. (b) The ‘Cofactors’ category includes various cofactors of enzymes but excludes ions, which are shown in the ‘Metal ions’ (c) and ‘Non-metal ions’ (d) categories.

