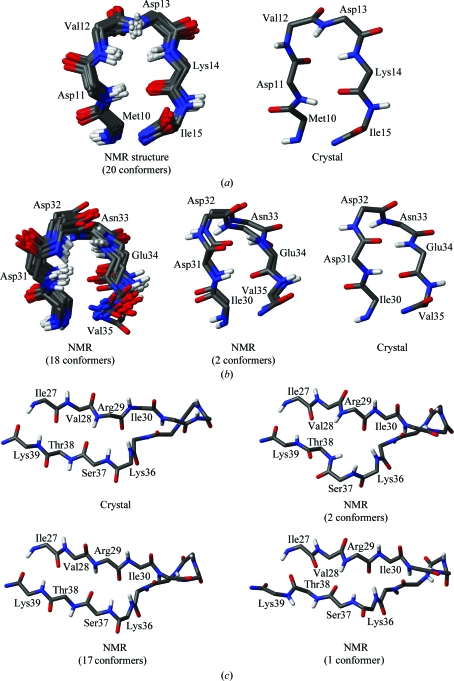
Figure 6.
Stick representations of polypeptide segments in the NMR structure and in the crystal structure that show local variation as discussed in the text. C, N, O and H atoms are colored black, blue, red and gray, respectively. (a) Residues 10–15. (b) Residues 30–35. (c) Residues 27–39, which undergo a dynamic process involving residues 36–39, as evidenced by the NMR data in Fig. 7 ▶.

