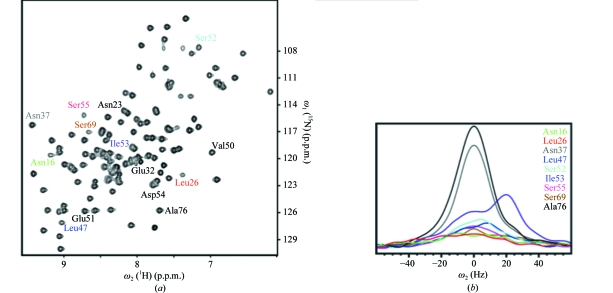
Figure 10.
NMR evidence for slow local conformational exchange in the NMR structure of TM1081. (a) 2D [15N,1H]-HSQC spectrum of a 1.0 mM solution of uniformly 15N-labeled TM1081 recorded at 800 MHz and 313 K. The cross-peaks shown in (b) are identified. (b) Cross-sections along ω2(1H) through the cross-peaks identified with the corresponding color code in (a).

