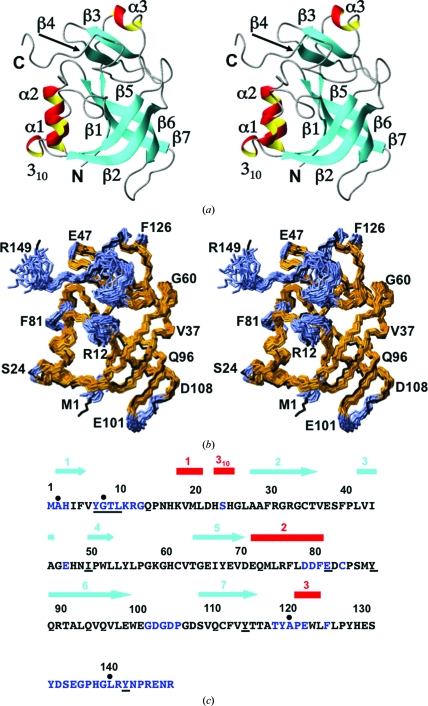
Figure 2.
NMR structure of the protein A2LD1 and comparison with the crystal structure. The same presentation is used as in Fig. 1 ▶, but the following should be noted. In (b), the polypeptide-backbone heavy atoms of residues 2–100 and 106–144 were superimposed for best fit. The residues with global displacements  > 0.64 Å are indicated by blue coloring in (b) and are represented by blue letters in (c). In (c), residues forming the catalytic site are underlined (see text).

