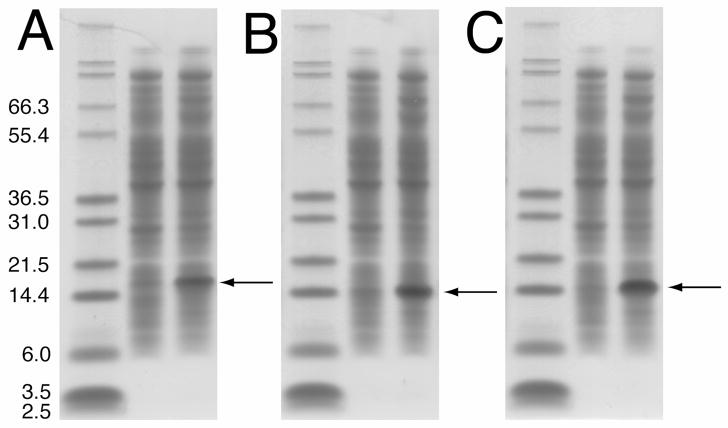
Figure 4.
SDS-PAGE gel showing the expression of each of the three p7 protein constructs. The gels for (A) p7, (B) p7TM1 and (C) p7TM2 show the expression level of the fusion protein before and 4 hours after induction with IPTG. The arrow indicates the band representing the over-expressed fusion protein in each case.

