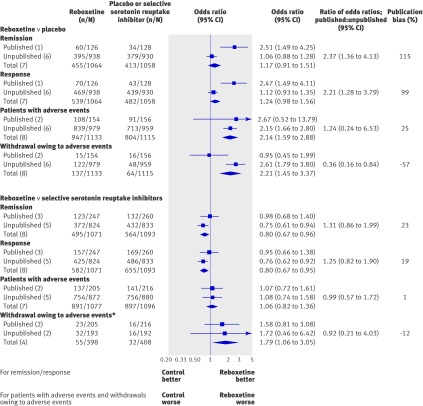
Fig 6 Forest plot showing meta-analyses of published, unpublished, and all trials. Publication bias (right column) is presented as the ratio of odds ratios of published results versus overall results. The extent of publication bias is expressed as percentage change between the analysis of published trials only and the analysis of all trials (that is, publication bias=100×(ORpublished data/ORtotal data–1)). *Fluoxetine controlled studies only

An official website of the United States government
Here's how you know
Official websites use .gov
A
.gov website belongs to an official
government organization in the United States.
Secure .gov websites use HTTPS
A lock (
) or https:// means you've safely
connected to the .gov website. Share sensitive
information only on official, secure websites.
