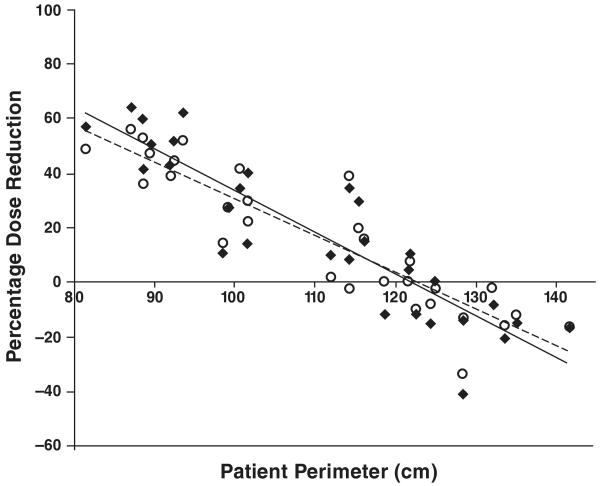
Fig. 4.
Graph shows correlation between patient perimeter and percentage reduction or increase in dose to glandular breast (R2 = 0.81) and lung (R2 = 0.82) with use of tube current modulation as opposed to fixed tube current in chest CT. Negative percentage dose reduction value denotes increase in organ dose with use of tube current modulation as opposed to fixed tube current.

