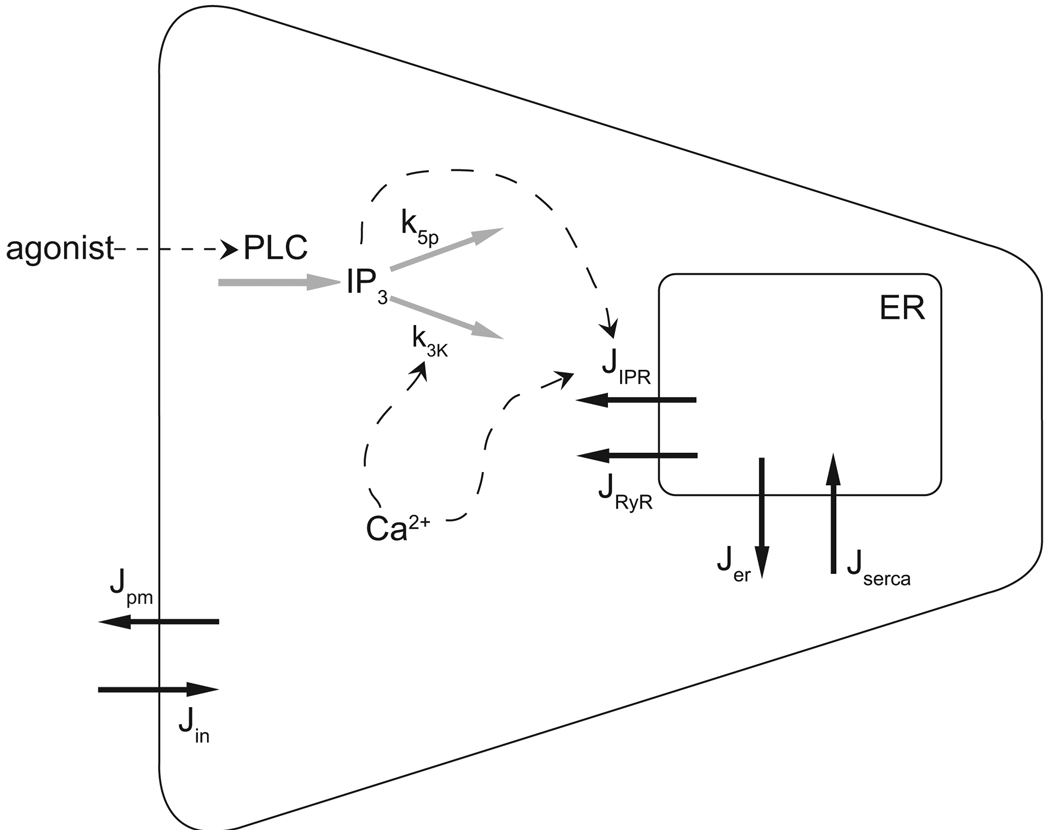
Figure 2.
Schematic of the calcium model. Ca2+ fluxes are shown with solid black arrows. IP3 and Ca2+ feedback on the IP3R and IP3 degradation are shown with dashed arrows. Agonist concentration stimulates IP3 production via PLC. IP3 then degrades by dephosphorylation at rate k5p and phosphorylation at a Ca2+-dependent rate k3K (grey arrows). Increases in Ca2+ and IP3 concentration raise the open probability of the IP3R, releasing Ca2+ from the ER.

