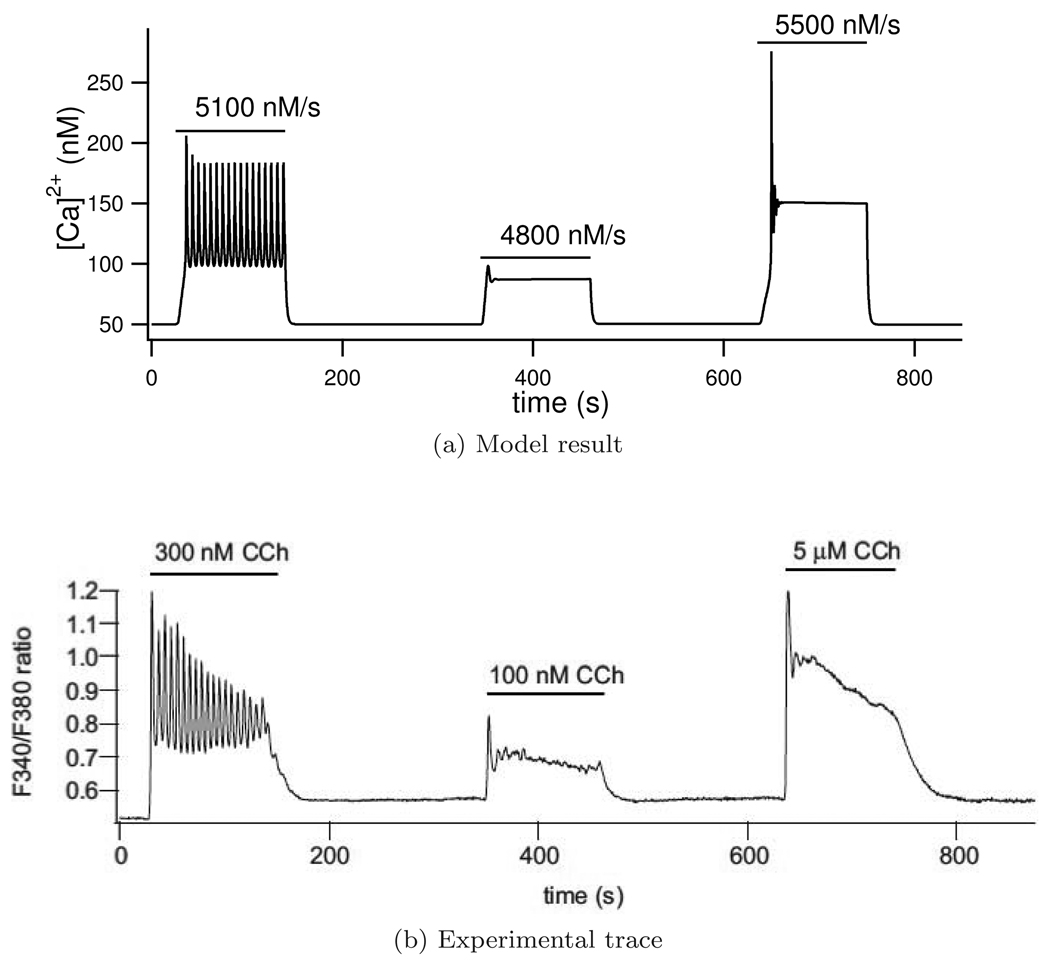
Figure 5.
Ca2+ traces for three agonist concentrations with the model result in (a) and the experimental trace (b) reproduced from original figure in Gin et al. (2007) with permission from the authors. Parameter ν is zero except when indicated by a horizontal bar with its non-zero value written above. In the experimental trace, F340/F380 represents the fluorescence of fura-2 and gives a measure of Ca2+ concentration.

