Figure 1.
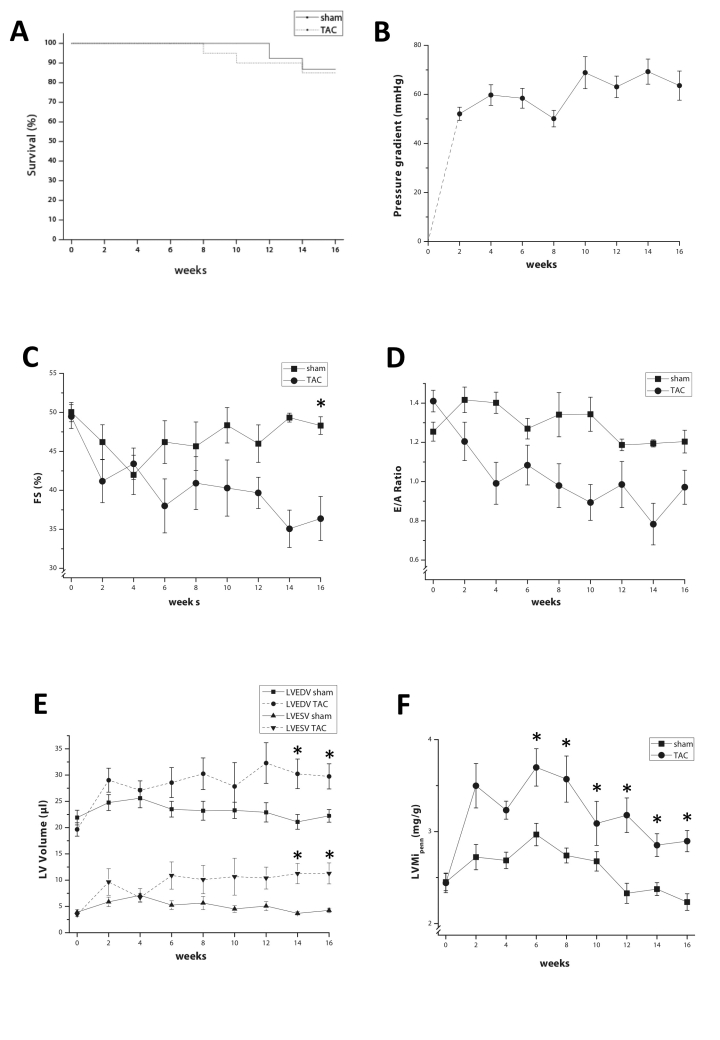
A) Kaplan-Maier plot of 16-week survival in TAC and sham mice. B) Development of the pressure gradient across the aortic constriction as determined by Doppler echo. C) Fractional shortening (%) during the 16-week follow-up period in TAC and sham mice. D) Evolution of E/A ratio over time. E) Left ventricular end-diastolic volumes (LVEDV) and end-systolic volumes (LVESV) in TAC and sham mice. F) Left ventricular mass index in TAC and sham mice as calculated from B-mode echocardiography. Asterisks indicate p≤0.05.

