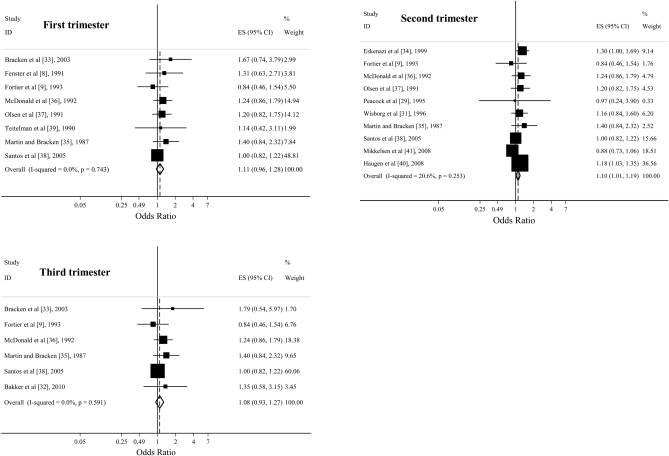
FIGURE 2.
Odds ratios from cohort studies estimating the association between prenatal caffeine consumption (highest compared with lowest intake) in the first, second, and third trimesters and preterm birth. Squares indicate study-specific estimates, horizontal lines indicate the 95% CIs, and diamonds indicate the summary estimate of the odds ratio with its corresponding 95% CI. ES, effect size; ID, identification.

