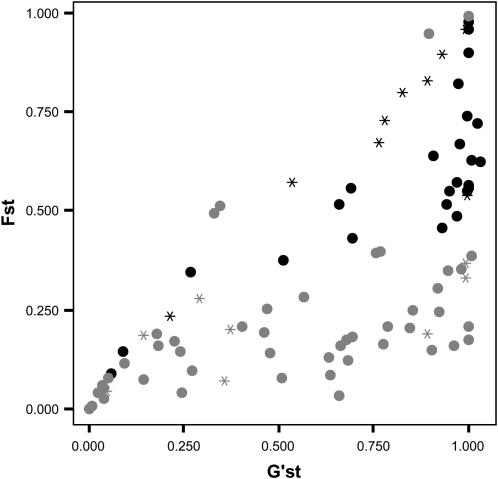
Figure 2.—
Results of a genomic scan for interspecific divergence between P. alba and P. tremula for the Austrian Danube hybrid zone, based on 93 DNA-based genetic markers. Hedrick's (2005) G′ST is shown on the x-axis and FST on the y-axis. Marker loci with greater-than-expected FST (99% level) relative to neutral expectations are solid; all other markers are shaded. Circles indicate markers derived from genomic DNA sequence (genomic libraries or P. trichocarpa shotgun genome sequence), stars stand for markers sourced from expressed sequence tags (ESTs). Marker loci with maximum interspecific divergence for their heterozygosity are visible along the diagonal.

