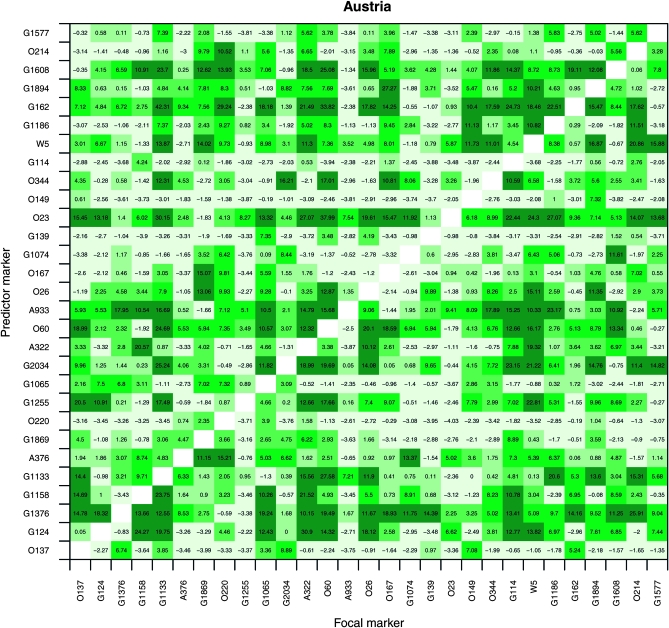
Figure 4.—
Results of tests for epistatic interactions between pairs of loci in the Danube hybrid zone, carried out for those 29 loci with the greatest interspecific divergence (allele frequency differential δ ≥ 0.8). Shown are differences between AIC values (ΔAIC) for logistic regression models that include vs. models that exclude a second predictor locus to predict genotypes at a focal locus (i.e., epistasis vs. single-locus models). Large values of ΔAIC indicate that the model fit is substantially greater for the epistasis model. The cells with the darkest green indicate a positive AIC difference of 10–50 (natural logarithmic scale) for the epistasis model relative to the one-locus model and the next shade of green an AIC difference of 5–10, and then 2–5, and then 0–2. See text for details of regression models.

