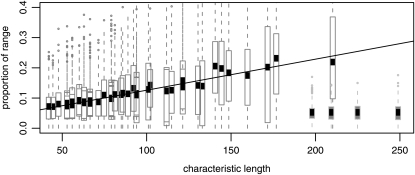
Figure 8.—
Empirical mean range sizes occupied by distinct types depend linearly on the characteristic length. Shown are the results of 818 simulations at 45 distinct parameter combinations of N, m, r, and s and local dispersal (open boxes) as well as 90 simulations at a larger value of N and with dispersal on the order of the species range (shaded boxes). All had μ fixed at 10−7; see text for parameter choices otherwise. For each set of parameter values, between 10 and 30 independent simulations were carried out, and the areas (as a proportion of the total range) occupied by each distinct type were tabulated. A boxplot of the resulting 45 distributions is shown, with the characteristic length computed using Equation 3 on the horizontal axis. Since the characteristic length does not depend on r, some boxplots overlap. The boxplots are standard (boxes extend from the first to the third quartiles), except that the means are shown as a solid box, since it is the mean occupied area that is expected to be linearly proportional to χ. Shown is the regression line of proportion occupied against characteristic length, using only simulations with local dispersal.

