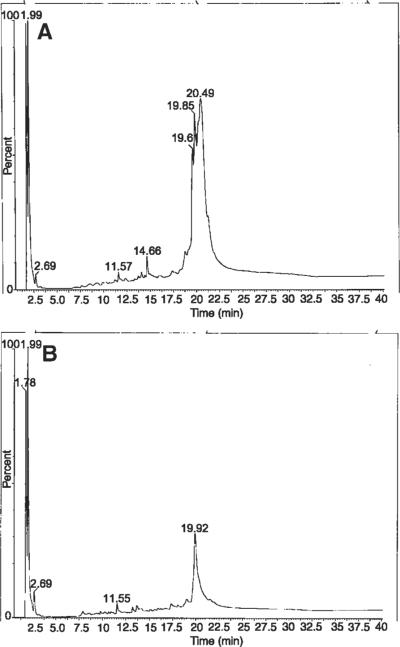
Figure 3.
HPLC analysis of the samples presented in Figure 2 after additional digestion. The synovial fluid samples were digested with hyaluronidase (1 U/μL, 12 h, 37°C), CNBr (6 h, room temperature) and trypsin (1 mg/mL, 24 h, 37°C) (A, B). Note the diminished intensity of the high mass peak ~25–26 m shown in Figure 2 and the appearance of several lower mass protein peaks eluting in the region of 5–18 m in the CNBr and trypsin-treated samples.

