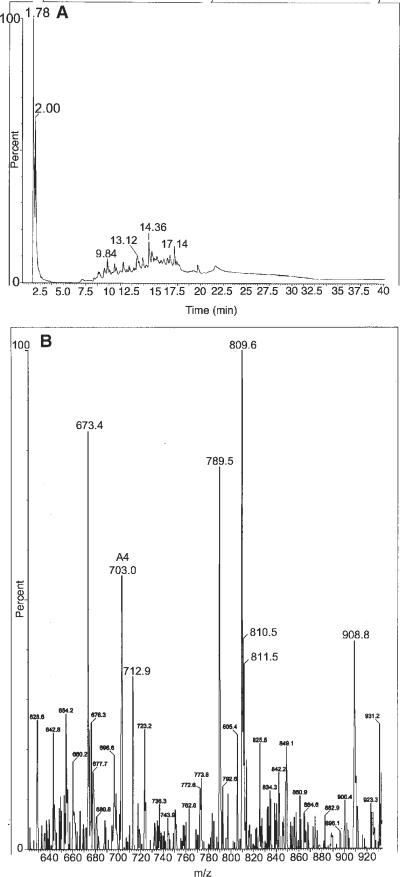
Figure 4.
HPLC-MS results of a synovial fluid sample from the early OA group after thorough protein digestion. Note the HPLC analyte at 13.12 m that correlates with a Cl-peptide (A) and the appearance of a singly charged signal with an isotopic distribution consistent with the presence of Cl at m/z 809.6 (B).

