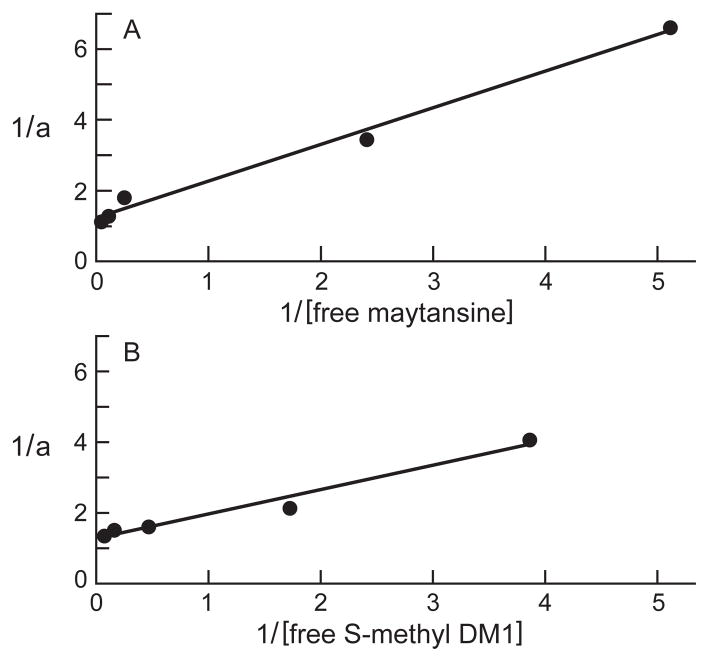
Figure 4.
Binding of maytansine (A) or S-methyl DM1 (B) to tubulin. Maytansine (0.5–20 μmol/L) or S-methyl DM1 (1–8 μmol/L) was incubated with 3 μmol/L tubulin in PEM buffer for 45 min at 30 °C. The relative intrinsic fluorescence intensity of tubulin was monitored as described in ‘Materials and Methods’. The plot indicates a dissociation constant (KD) of 0.86 ± 0.23 μmol/L for maytansine (A) and of 0.93 ± 0.22 μmol/L for S-methyl DM1 (B). The Y–axis shows the inverse of the fractional receptor occupancy (a) of compound and the X–axis shows the inverse of free maytansinoid concentration.

