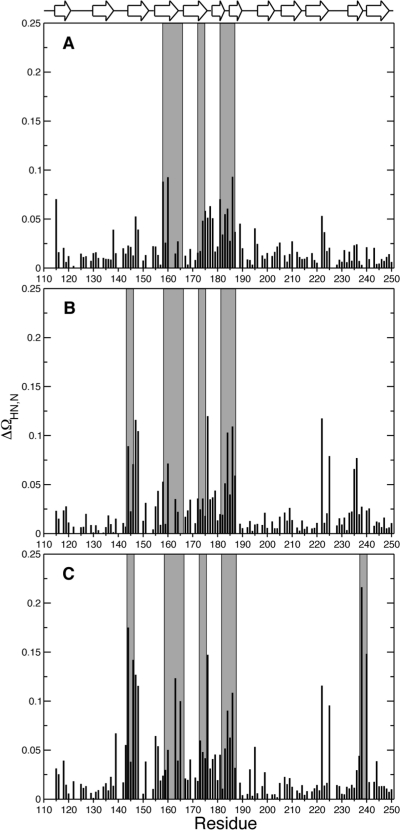
Figure 2.
Chemical shift differences between apo-Gal3C and the ligand-bound complexes. Δδ is plotted vs residue number for (A) Δδ(lac−apo), (B) Δδ(L2−apo), and (C) Δδ(L3−apo). Secondary structure elements are indicated at the top of the graph. Residues within 5 Å of the ligand are highlighted by gray bars.

