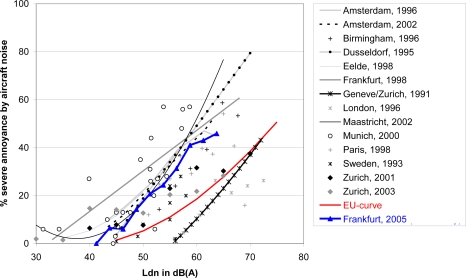
Figure 2.
Dose-response data for severe aircraft noise annoyance from several surveys using a cut-off point of 70–75% of response scale for definition of high annoyance (HA).
Source: van Kempen, und van Kamp ([42], p. 25, Figure 3b)—modified and supplemented; EU-curve: generalized dose-response curve for aircraft noise annoyance [43,44]. Source of the data of Zurich 2001/2003: Brink et al. [45]. Blue line and dots: data of the Frankfurt Noise Effect Study presented in this paper. References of all the other studies: see [42].

