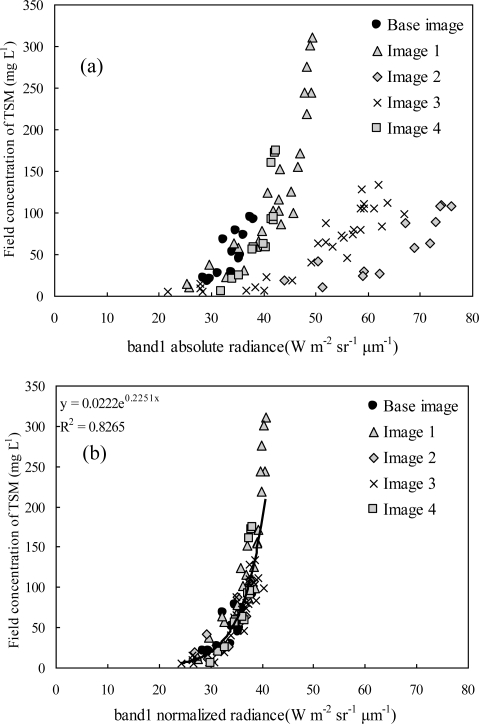
Figure 3.
(a) Relationship between TSM concentrations and band1 radiance before the atmospheric correction; (b) Relationship between TSM concentrations and band1 radiance after the atmospheric correction (base: January 2005, Taihu Lake area. Images 1–4: February, May, September and December, 2005, respectively).

