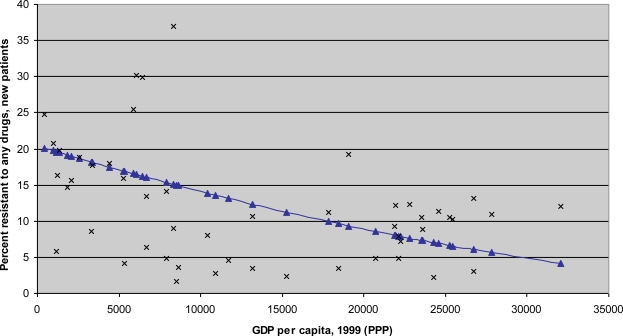
Figure 1.
The relationship between GDP per capita and resistance to any anti-Tuberculosis drug.
Source: Authors’ calculations based on resistance data from [22]. The resistance data is for 1999 or latest available year at the time of that publication. The curve in blue results from weighting each country’s TB resistance rate by that country’s TB population. The TB population in each country is calculated by multiplying its TB prevalence rate by its total population. For two large countries with different reported resistance rates across provinces, China and Russia, the national resistance rates are calculated as a weighted average of the reported provincial resistance rates, where the weights represent the TB population of the relevant province(s). Data on Gross Domestic Product (GDP) per capita for 1999 comes from the World Bank’s World Development Indicators database, available through http://www.worldbank.org/data/. GDP per capita is expressed in internationally comparable dollars using purchasing power parity (PPP).

