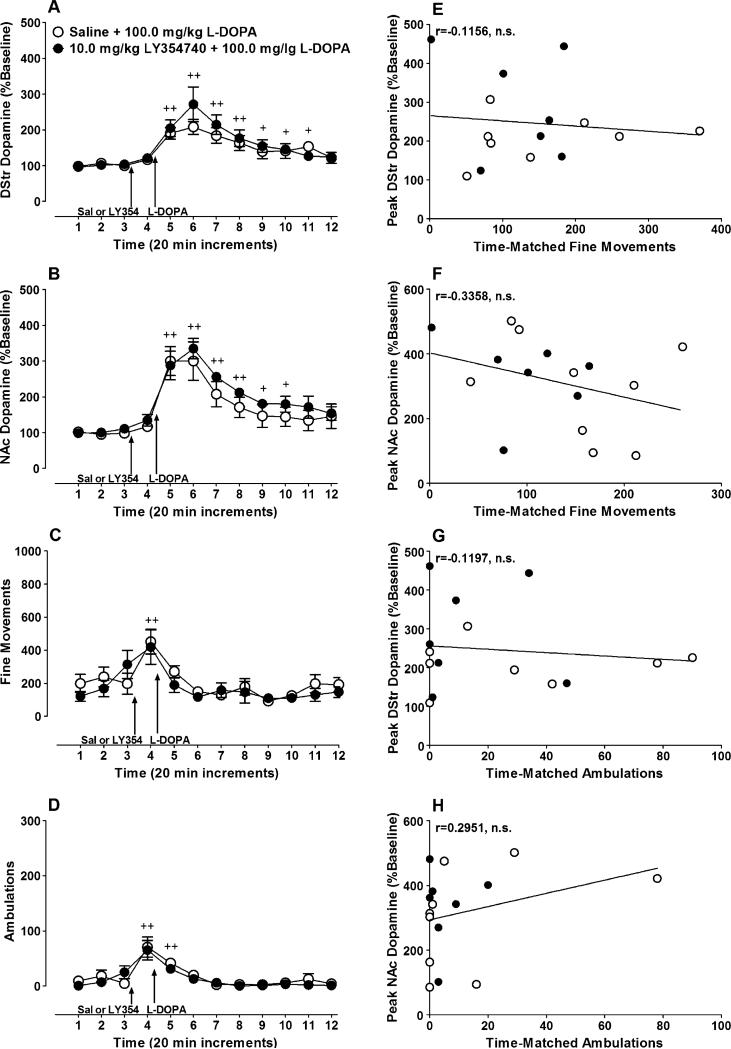
Fig. 4.
LY354740 pretreatment has no effect on L-dopa-induced increases in dopamine release. Rats were given an IP injection of 10.0 mg/kg of LY354740 (filled circles) or 0.9% saline (open circles) 20 min prior to injecting 100.0 mg/kg of L-dopa. Dopamine release was measured in the a DStr (LY354740 group, n=8; mean baseline dopamine=1.2±0.1 fmol/μL; saline group, n=8; basal release=1.3± 0.3 fmol/μL) and b NAc (LY354740 group, n=7; mean baseline dopamine=0.7±0.2 fmol/μL; saline group, n=9; mean baseline dopamine=1.2±0.2 fmol/μL) for each animal. In addition, locomotor activity also was measured and is expressed as c fine movements (LY354740 group, n=9; saline group, n=14) or d ambulations (LY354740 group, n=9; saline group, n=14). No significant correlation was found between peak fine movements and dopamine release in e the DStr or f the NAc. Similarly, significant correlations were not found between g, h peak ambulations and dopamine release in either brain region. In graphs A, B, C and D, baseline dopamine release or locomotor activity is represented by the first three time points displayed. Plus signs denote significant increases in dopamine release or locomotor activity compared to baseline (+ p<0.05, ++ p<0.01). Note that the discrepancy in sample sizes between the DStr micro-dialysis graph and the related correlations is due to missing activity data for one subject. This missing data was caused by an unrecoverable computer error

