
Figure 12.
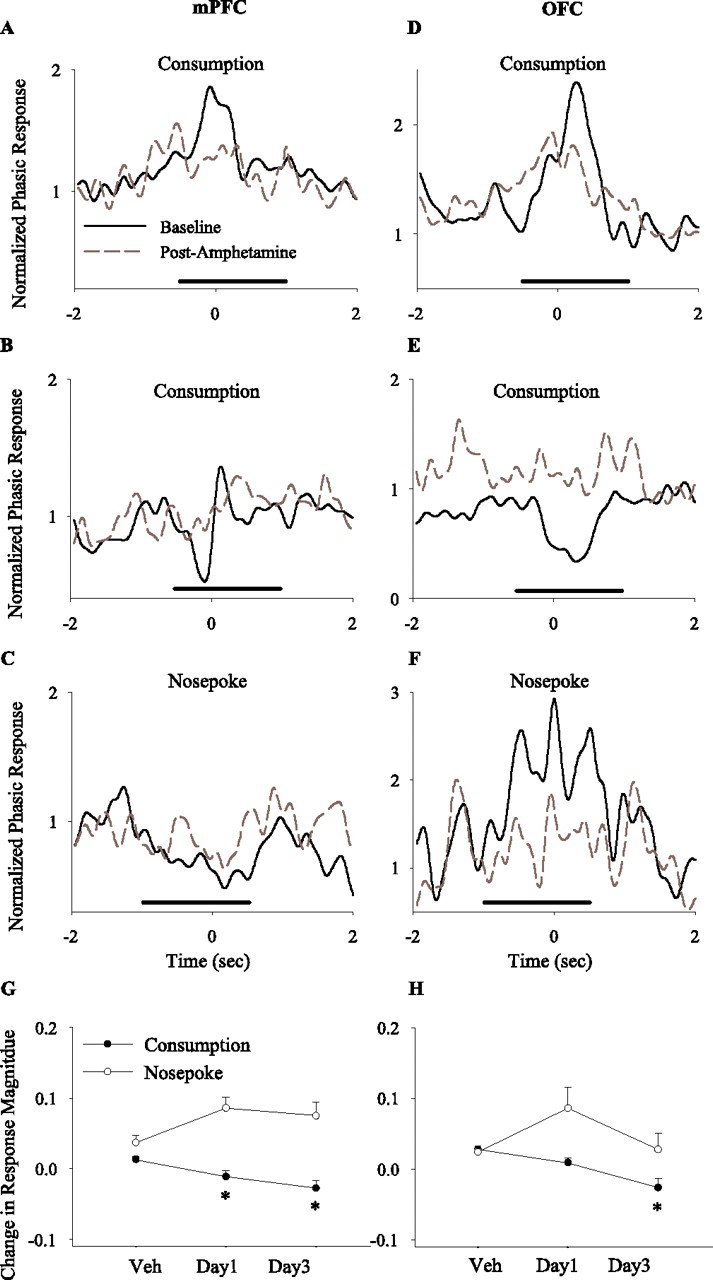
Effects of amphetamine on the magnitude of phasic task-related responses. A–F, Examples of mPFC (A–C) and OFC (D–F) individual phasic responses to task-related events (A–D, food consumption; E, F, instrumental response) before (solid black line) and after (dashed gray line) amphetamine treatment (2 mg/kg, day 3). Each section depicts the normalized perievent time histogram of a single unit using 50 ms bins (smoothed) within a ±2 s perievent window. For each neuron, the histogram bins were normalized using the precue window (−1.5 to −0.5 s before cue) as described in Materials and Methods. The solid line depicts the window of analysis for each event. A–D, Examples of amphetamine attenuating the magnitude of phasic consumption-related responses (A, B, neurons with a phasic increase response; C, a neuron with a phasic decrease–increase response; D, a neuron with a phasic decrease response). E, F, Examples of amphetamine attenuating the phasic response to instrumental nose poke (E, a neuron with a phasic decrease response; F, a neuron with a phasic increase response). G, H, Average within-session change in the magnitude of phasic responses in mPFC (G) and OFC (H). The normalized magnitude of each significant phasic response (regardless of directionality) was compared before and after amphetamine, and the differences were averaged per session. Amphetamine decreased the magnitude of consumption-related phasic responses in both regions (one-way ANOVA; mPFC, F(2,137) = 7.44, p < 0.001; OFC, F(2,134) = 10.13, p < 0.001) but did not alter the magnitude of nose-poke-related responses (mPFC, F(2,49) = 2.63, p > 0.05; OFC, F(2,91) = 1.93, p > 0.05). *p < 0.05 compared with vehicle.