
Figure 1.
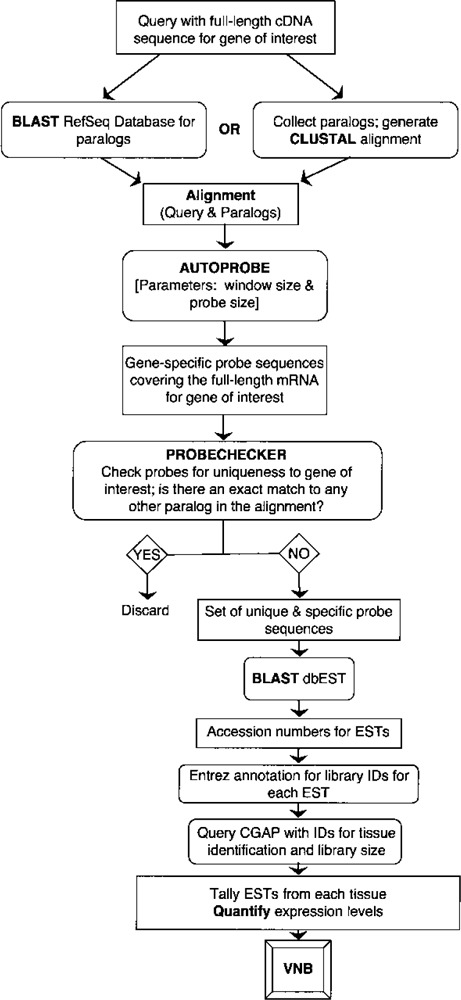
An Overview of VNB algorithm presented as a flow chart. A box represents either input data or a result. An oval represents an action. A diamond represents a decision point. A more informative description of the VNB algorithm is provided in Supplemental Materials.