
Figure 2.
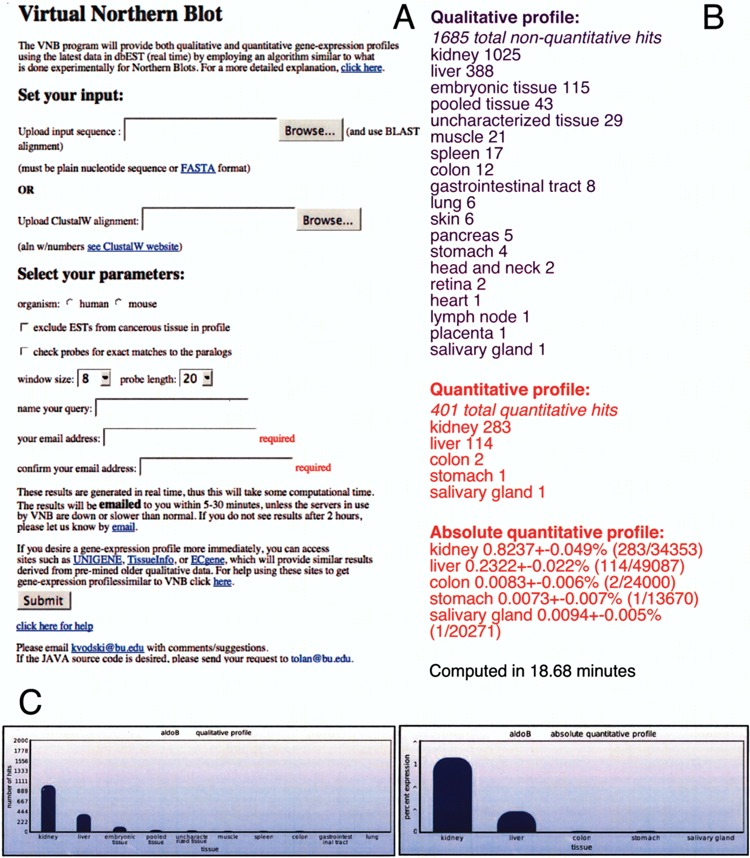
Illustration of the VNB user interface and output file. (A) The user interface for VNB at http://tlab.bu.edu/vnb.html. The “Set your input” section allows for the two different ways of inputting the query. The “Select your parameters” section allows the user to select the organism, normal/cancer tissues, activation of ProbeChecker, window size, and probe length. (B) A typical output for VNB using mouse aldolase B as an example, which is expressed predominantly in the liver and kidney. At the top (in purple), is the tissue expression profile grouped by total ESTs found and at the bottom (in red) is the quantitative tissue expression profile that uses only unmanipulated libraries as defined at CGAP. The numbers in parentheses are the absolute expression values obtained by dividing the number of ESTs found in each tissue by the total number of ESTs from that tissue. The errors are calculated to one standard deviation using a Poisson distribution. (C) A graphical representation of the information derived from (B). The qualitative profile, using all ESTs found, shows the top 10 tissues as a function of the number of ESTs. The absolute quantitative profile, using ESTs from nonnormalized libraries, shows the top tissues as a function of level of expression (fraction of total mRNAs).