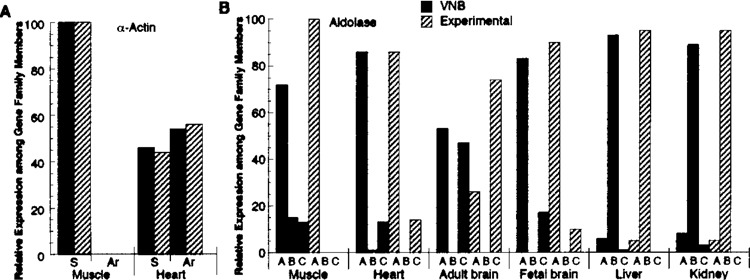
Figure 7.

Validity of qualitative expression profiles from VNB. (A) VNB-generated expression (solid bar) of genes for mouse skeletal α-actin (acta1) (S) and smooth-muscle (aorta) α-actin (acta2) (Ar) in skeletal muscle and heart plotted as a percentage of the total for each isoform in a tissue. This was plotted similarly to experimentally determined expression (cross-hatched bars) of α-actin from the same tissues (25), which was quantified as described in Materials and Methods. (B) VNB-generated expression (solid) for mouse aldoA, aldoB, and aldoC denoted by letters. The number of ESTs for each aldolase found in muscle, heart, adult brain, fetal brain, liver, and kidney were normalized to the total aldolase ESTs in each tissue. The VNB-generated profiles used default probe size (20) and window size (8). The experimentally determined expression (cross-hatched bars) of the aldolase isozymes was estimated from data in Lebherz and Rutter (37). Queries for mouse genes were: acta1 [GenBank:NM009606], acta2 [GenBank:NM007392], aldoA [GenBank:NM007438], aldoB [GenBank: NM144903], and aldoC [GenBank:NM009657].
