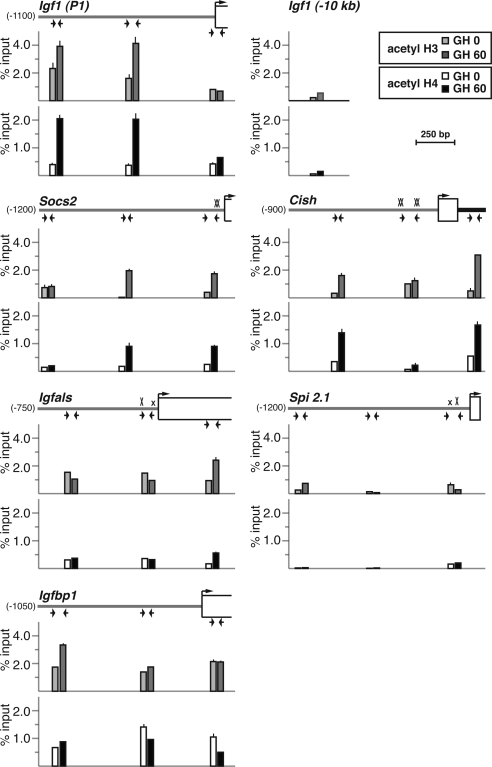
Figure 5.
GH induces histone H3 and H4 acetylation at hormone-responsive promoters. The graphs depict results of ChIP experiments by qPCR assessing acetylation of histone H3 (top) and H4 (bottom) at Igf1 promoter 1 and at the Socs2, Cish, Igfals, Spi 2.1, and Igfbp1 promoters in hepatic chromatin of pituitary-deficient rats before (light bars) or 60 min after (dark bars) a single systemic GH injection. The map shown above each pair of graphs illustrates the 5′-end of each gene. Horizontal arrows denote the locations of qPCR primers (see Table 2 for DNA sequences), a bent arrow indicates the transcription start site, and boxes represent exons. An X marks each Stat5b site (smaller x’s are imperfect sites). Depicted results represent the mean ± sd of three independent experiments (the lack of an error bar indicates that the sd is too small to be visualized). The negative control is from a region located approximately 10 kb 5′ to IGF-I exon 1.

