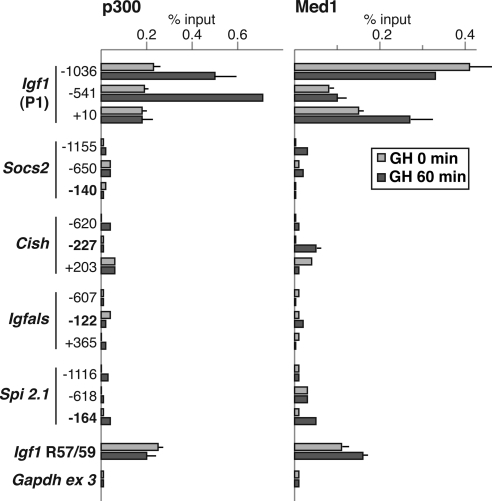
Figure 7.
Selective binding of transcriptional cofactors p300 and Med1 to Igf1 promoter 1. The graphs present results of ChIP experiments by qPCR assessing binding of p300 (left) and Med1 (right) at three locations in Igf1 promoter 1 and in the Socs2, Cish, Igfals, and Spi 2.1 promoters in hepatic chromatin of pituitary-deficient rats before (light gray bars) or 60 min after (dark gray bars) a single systemic GH injection. The R57-59 Stat5b binding domain of Igf1 serves as a positive control and Gapdh exon 3 serves as a negative control. Numbers indicate locations of PCR primers (bolding denotes Stat5b-binding regions; see Table 2 for DNA sequences). Results represent the mean ± range of two independent experiments (the lack of an error bar means that the range is too small to be seen on the graphs).

