Figure 1.
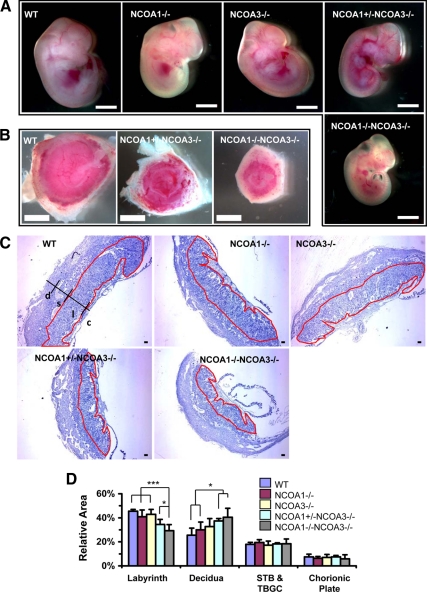
Disruption of NCOA1 and NCOA3 in mice restricted fetal and placental growth. A, E12.5 mouse embryos with indicated genotypes. Scale bar, 2 mm. B, E12.5 mouse placentas with indicated genotypes. Scale bar, 2 mm. Panel C, H&E-stained middle sagittal sections of E12.5 mouse placentas. The labyrinth area in each panel is circulated by red line. c, chorionic plate; l, labyrinth; s, spongiotrophoblast; d, decidua. Scale bar, 100 μm. Panel D, The relative areas of placental components for the indicated genotype groups. For each of the middle sagittal section of placenta, the labyrinth area, deciduas area, STB and TBGC area, chorionic plate area, and total placental area were separately measured, after which the percentages of a specific area to total area was calculated. For each group four to eight placentas were measured. *, P < 0.05; ***, P < 0.001, compared by unpaired t test between any two groups. STB, Spongiotrophoblast; TBG, trophoblast giant cell.

