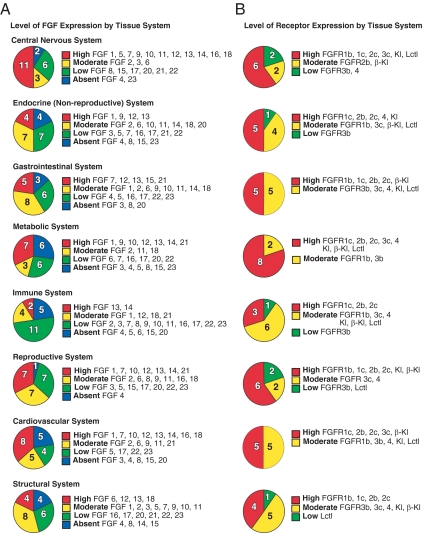
Figure 5.
Tissue distribution of FGFs and FGFRs in adult mouse. A, FGF expression by tissue system. B, FGFR and Klotho coreceptor expression by tissue system. Expression levels in different tissue systems are indicated. Normalized FGF mRNA expression levels were defined as absent if the cycle time value was more than 34, low if the level was below 0.01 arbitrary units, moderate if the level was between 0.01 and 0.1, and high if the level was equal to or greater than 0.1 arbitrary units. Tissue systems are defined as CNS (eye, brainstem, cerebellum, cerebrum, corpus striatum, olfactory bulb, spinal cord, hypothalamus, and pituitary), endocrine (adrenal and thyroid), GI (tongue, stomach, duodenum, jejunum, ileum, colon, pancreas, and gall bladder), metabolic (liver, kidney, brown and white adipose tissue), immune (spleen and thymus), reproductive (ovary, uterus, epididymus, preputial gland, prostate, seminal vesicles, testis, and vas deferens), respiratory (aorta, heart, and lung), and structural (muscle, bone, and skin). Tissues were pooled from C57/Bl6 mice (n = 6).

