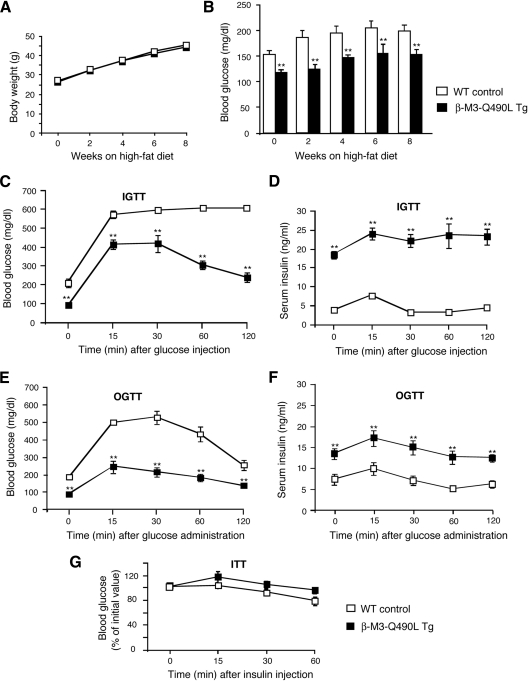
Figure 4.
Physiological analysis of β-M3-Q490L Tg mice and control littermates maintained on a high-fat diet. A, Growth curves of male mice maintained on a high-fat diet (n = 8 per group). Mice were put on the high-fat diet when they were 5 wk old. B, Fed blood glucose levels of male mice maintained on a high-fat diet (n = 7 per group). C, IGTT. Blood glucose levels were measured at the indicated time points after ip administration of glucose (2 mg/g body weight; 16-wk-old males; n = 6 per group). D, Serum insulin levels after ip administration of glucose (2 mg/g body weight; 16-wk-old males; n = 6 per group). E, OGTT. Blood glucose levels were measured at the indicated time points after oral administration of glucose (2 mg/g body weight; 16-wk-old males; n = 6 per group). F, Serum insulin levels after oral administration of glucose (2 mg/g body weight; 16-wk-old males; n = 6 per group). G, Insulin tolerance test (ITT). Blood glucose levels were measured at the indicated time points after ip administration of insulin (0.75 U/kg; 20-wk-old males; n = 6 per group). Data are expressed as means ± se. *, P < 0.05; **, P < 0.01, compared with the corresponding WT value.

