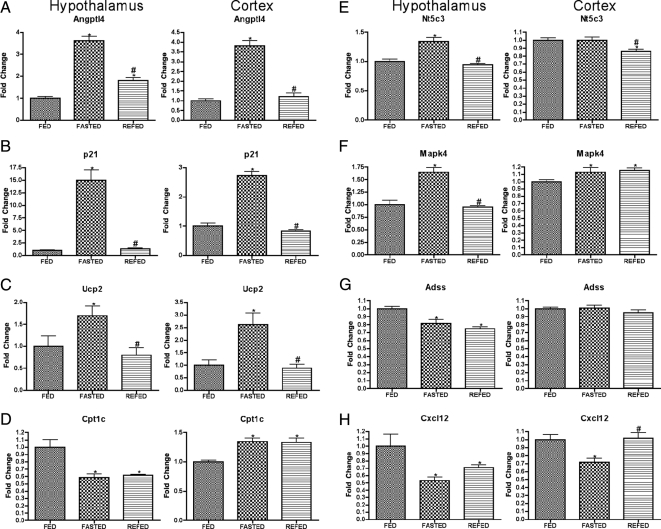
Figure 3.
Expression of genes involved in a variety of functions after fasting and refeeding in hypothalamus and cortex. Quantitative real-time PCR data for murine genes Angptl4 (A), p21 (B), Ucp2 (C), Cpt1c (D), Nt5c3 (E), Mapk4 (F), Adss (G), and Cxcl12 (H) in hypothalamus (left graph in each panel) and cortex (right graph in each panel). Data for each gene were normalized to a panel of housekeeping transcripts and expressed as fold change compared with the FED group. Data are means ± sem (n = 6–12). *, P < 0.05 compared with FED group; #, P < 0.05 for REFED compared with FASTED group (ANOVA).

