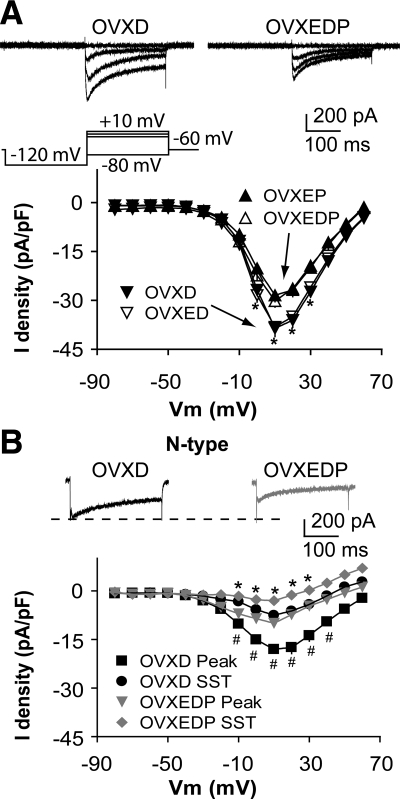
Figure 5.
Cotreatment with P blocks the DHT-induced augmentation of ICa in GnRH neurons. A (top), Representative traces showing activation of ICa in GnRH neurons from OVXD (left) and OVXEDP (right) mice. For clarity, only four voltage steps during the test pulse (−80, −10, 0, and 10 mV) are shown; bottom, average I-V plot. B, Representative N-type current in response to a step from −90 to +10 mV (top) and average I-V plot (bottom). Data from OVXD and OVXED mice are repeated for comparison. *, P < 0.05 SST; #, P < 0.01 peak, OVXEP vs. OVXE.

