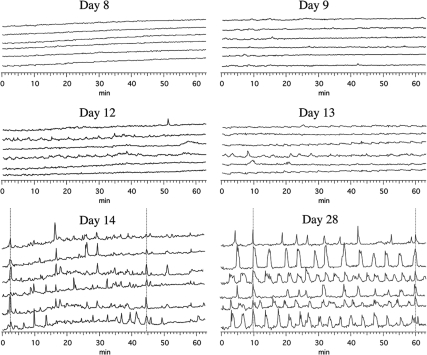
Figure 1.
Developmental pattern of [Ca2+]i dynamics in monkey GnRH neurons. Representative [Ca2+]i traces from individual GnRH neurons at 8, 9, 12, 13, 14, and 28 div are shown. Note that there is little fluctuation of [Ca2+]i levels in young cultures (8 and 9 div, top panels). At 12–13 div, small fluctuations of [Ca2+]i start to appear (middle panels). After 14 div, most of GnRH neurons exhibit prominent oscillatory patterns of [Ca2+]i. Periodic synchronizations of [Ca2+]i oscillations are seen in older cultures. Synchronization of [Ca2+]i oscillations in the majority GnRH neurons are indicated by vertical lines.

