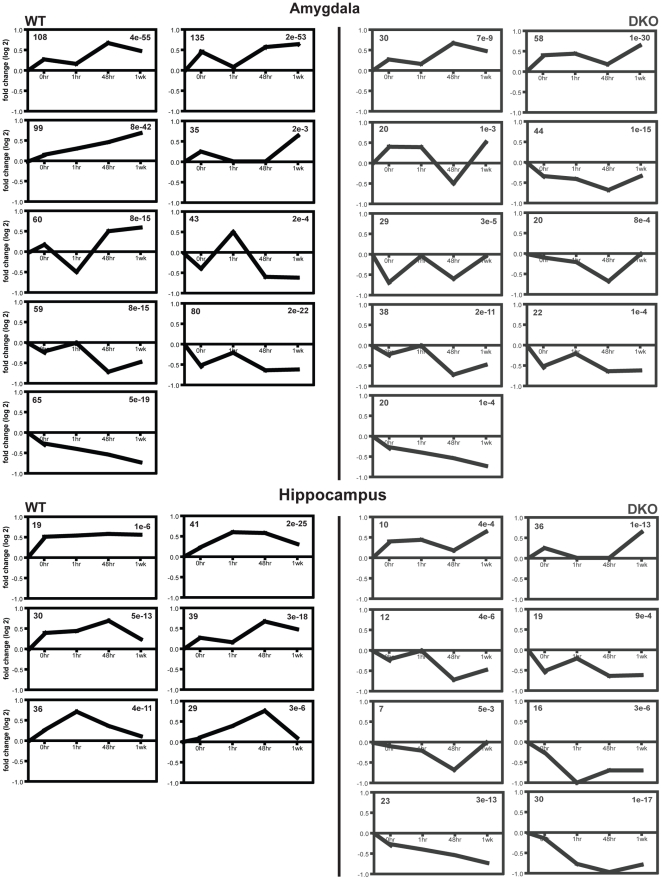
Figure 3. Cluster analysis reveals the most represented expression pattern changes occuring over time after CF learning.
Amygdala results reveal a balance between up and downregulated gene changes in WT mice. DKO mice reveal an overall decrease in gene expression within the amygdala over time. Four similar clusters are found between both the WT and DKO mice in the amygdala. WT mice show a consistent upregulation in gene expression over time within the hippocampus; whereas, DKO mice genes tend to be downregulated over time except for two clusters. No two clusters are alike between WT and DKO mice. The number in the upper left corner represents the number of genes in the cluster and the number in the upper right reveals the p-value.

