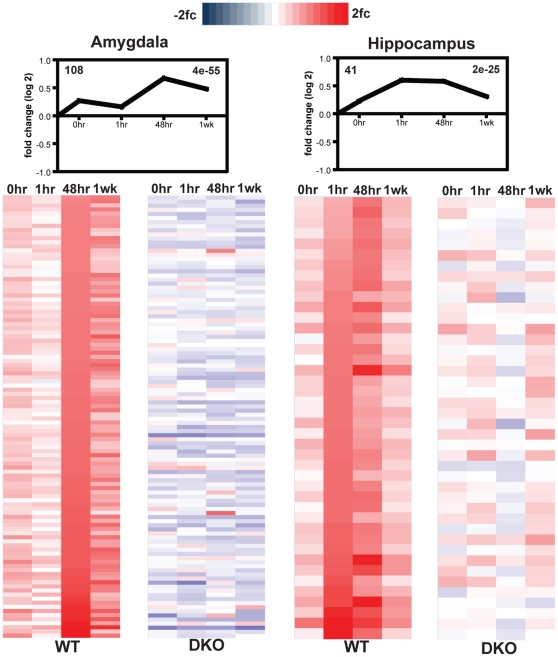
Figure 4. Heat map analysis reveals divergent gene expression changes.
A heat map was generated for the most significant cluster in each brain region of WT mice. The gene changes are mapped in the WT mice, and the respective changes in expression of the same genes are mapped in the DKO mice. (A) The amygdala results reveal not only a suppression, but opposing regulation in gene expression in DKO mice. (B) The hippocampal results reveal an overall suppression in gene changes within DKO mice.

