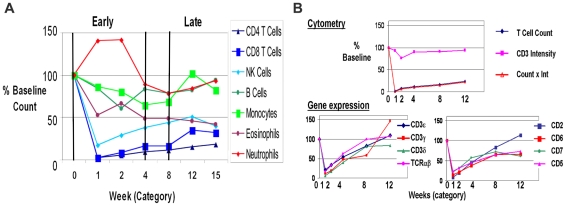
Figure 1. Serial cytometry profiling of cell subset populations shows distinct patterns of depletion and recovery early post transplantation.
(A). Absolute cell counts were determined and expressed as a percent of the counts pre-treatment. Multiple changes were observed in peripheral blood cell populations following transplantation, induction antibody therapy and drug-based immunosuppression. The different major cell populations show distinct patterns of depletion, gain and recovery as a function of time in the first 12 weeks, which we have defined as the “early” post transplant period. The gradual recovery of each of the subsets in time after transplant demonstrate that a proliferative expansion of at least subpopulations of these cells is underway despite the many individual differences observed. (B). T cell counts and mRNA show the same pattern of depletion and recovery. Cytometry variables for comparison to gene expression included: cell counts and expression intensity – mean per cell. CD3 intensity per cell is constant with treatment. The product of count and intensity (Count x Int) integrates the expression of each marker on each subpopulation at each time point and is the sum of the mean intensities of the given marker multiplied by all the cells identified in that population at any given time point. Count x Int. gives the same relative to baseline as absolute counts, indicating that the loss of T cells, not CD3 intensity, is the key changing parameter. Gene expression shows a consistent pattern for the 8 variables representing known T cell markers and correlates well with T cell counts. This is the first example of a proteogenomic validation of the results.

